

If you are one of those people who would rather skip through a video to get to the most interesting part, then this update is for you!
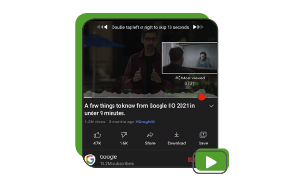
YouTube is currently testing a new metric called ‘Engagement Graph’ that will highlight the most watched portions of a clip in a playback progress bar graph.
YouTube explains the new metric as follows:
“We’re experimenting with showing viewers a signal to help them quickly see which parts of a video may be interesting. If you’re in this experiment, you’ll see a graph above the red progress bar while scrubbing - if the graph is high, it means that part of the video has been frequently re-watched.”
At this point of the test, the graph will highlight peaks and troughs when you scrub through the clip, which is a direct representation of users’ viewing responses of the video.
The option is currently being tested with a small percentage of users, and it’s unclear if or when this will roll out to everyone.
Learn more here.